
Taming the Ticket Storm

📑 Table of Contents
- 1. Executive Summary
- 2. Introduction: The High Cost of Reactive Support
- 3. The Strategic Imperative: Shifting Left to Prevent Customer Issues
- 4. The Diagnosis: Uncovering the Hidden Drivers of Support Demand
- 5. The Operational Framework: A Three-Stage Strategy for Proactive Success
- 6. The Payoff: Quantifying the Strategic Impact
- 7. Analysis: Key Success Factors & Leadership Lessons
- 8. The Evolution: From Proactive to Predictive Support Operations
- 9. Conclusion: Redefining Support as a Symptom of Upstream Health
- 10. Appendix: A Comprehensive KPI Framework for Cross-Functional Success
1. Executive Summary
In the high-stakes world of SaaS, support teams are traditionally seen as the first line of defense against customer issues. But what if the battle is already lost before a ticket is ever created? This case study reveals how a strategic operational initiative targeted the root cause of rising support volume, uncovering that the problem wasn't in the support center, but upstream in the customer onboarding and implementation process.
In this case, support ticket volume increased 28% over two quarters, resulting in:
- Declining SLA adherence
- Growing ticket backlog
- Longer resolution times
- Increased operational cost
SLA compliance was threatened, and operational efficiency was plummeting. A deep-dive analysis exposed a startling truth: over 40% of all support tickets stemmed from onboarding and configuration issues—problems that should have been resolved during implementation.
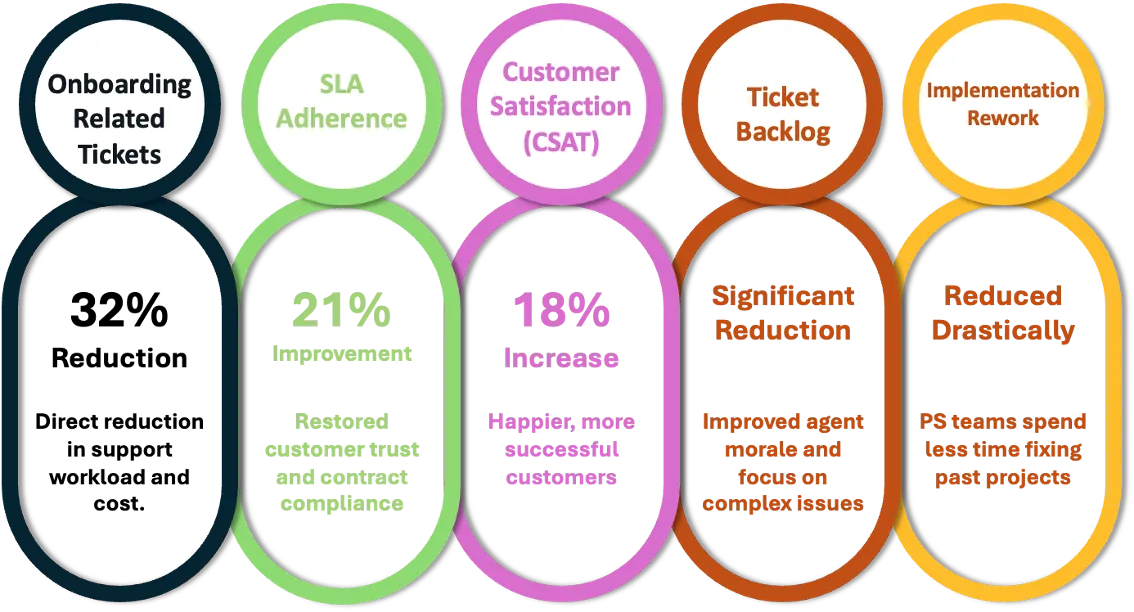
By deploying a three-stage operational framework centered on data-driven discovery, cross-functional alignment, and preventive customer enablement, the organization achieved transformative results in just two quarters:
- 32% reduction in onboarding-related support tickets
- 21% improvement in SLA adherence
- 18% increase in customer satisfaction (CSAT)
This case study provides a powerful blueprint for any organization seeking to move beyond reactive firefighting. It demonstrates that by strategically aligning Professional Services and Support, you can prevent avoidable demand, enhance customer experience, and build a truly proactive customer success ecosystem.
2. Introduction: The High Cost of Reactive Support
Customer support is often treated as the primary mechanism for resolving customer issues, but it is frequently only addressing symptoms rather than root causes.
During the period analyzed, the support organization began experiencing:
- Increased ticket volume
- Higher escalation rates
- SLA breaches
- Growing operational strain
A rising tide of support tickets is often mistakenly celebrated as a sign of product growth and customer engagement. But for the savvy operator, it's frequently a distress signal from deeper within the organization. In this instance, the support organization was drowning. Key metrics were flashing red:
- Ballooning Ticket Backlog: Unresolved issues piled up, overwhelming agents.
- Declining SLA Adherence: Response and resolution times missed targets, eroding customer trust.
- Rising Resolution Times: Problems became more complex and time-consuming to solve.
The immediate, intuitive response would have been to throw more bodies at the problem—a costly and short-sighted fix. However, leadership chose a different path. They hypothesized that the relentless surge in tickets was not a capacity issue, but a symptom of upstream failures. The central question became: What is causing these problems to occur in the first place?
3. The Strategic Imperative: Shifting Left to Prevent Customer Issues
Support organizations are too often relegated to the role of symptom managers. They are the fire department, constantly putting out blazes without ever investigating the arsonist. This initiative was founded on a powerful, strategic hypothesis: The most scalable and cost-effective way to reduce support volume is not to hire more agents, but to prevent problems from ever reaching them.
This concept, often called "shifting left," posits that by optimizing the implementation and onboarding processes to fully equip customers for success, a significant portion of support demand can be eliminated entirely. The goal was not to scale the support team, but to systematically reduce the volume of avoidable tickets through upstream operational excellence.
A structured ticket analysis revealed that a large portion of issues originated before customers ever interacted with support teams.
Common issues included:
- Incorrect system configurations
- Incomplete integrations
- Customers not fully trained on workflows
- Misalignment between implementation teams and operational teams
In other words, support teams were solving problems created during onboarding.
4. The Diagnosis: Uncovering the Hidden Drivers of Support Demand
Before a solution could be engineered, the root cause had to be surgically identified. An initial assessment revealed three critical structural failures that were creating a perfect storm of support demand.
4.1 The Visibility Gap: Operating in Functional Silos
Support and Professional Services (PS) operated as separate kingdoms, each with its own data, metrics, and priorities.
This resulted in:
- Limited insight into how implementation decisions affected support demand
- Lack of shared operational analytics
- No structured feedback loop between teams
As a result, recurring problems persisted without being addressed at their origin.
Support meticulously tracked ticket data, but those insights never reached the PS teams who were building the customer environments. Conversely, PS maintained detailed project plans, but support agents were blind to the unique configurations and complexities of the accounts they were tasked with helping. This data silo prevented systemic issues from being identified and addressed.
4.2 The Process Gap: The Perils of an Informal Handoff
The transition from "implementation completed" to "customer supported" was alarmingly ad-hoc. There was no standardized process. Common consequences included:
- Missing Configuration Roadmaps: Support engineers were troubleshooting systems with no documentation on how they were built.
- Tribal Knowledge Loss: Critical insights from the implementation team vanished as they moved on to the next project.
- Invisible Customizations: Complex integrations and custom workflows were a mystery to support, turning every ticket into a costly discovery process.
4.3 The Enablement Gap: Leaving Customers Unprepared for Success
"Go-live" was defined by technical deployment, not customer readiness. This narrow definition meant customers were often cut loose without the tools they needed to thrive, lacking:
- Adequate Workflow Training: They knew how to log in, but not how to use the product effectively for their business needs.
- Operational Best Practices: No guidance on how to manage the system day-to-day.
- Confidence and Independence: Every minor question or uncertainty became a new support ticket.

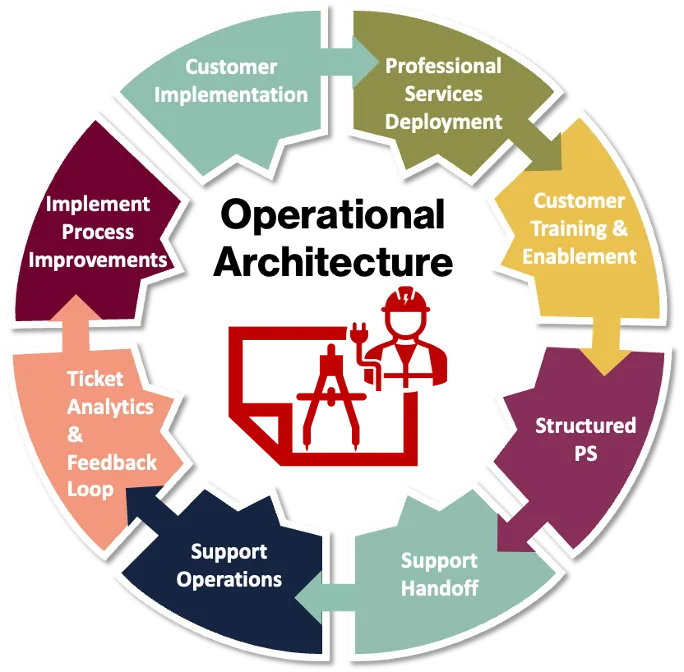
5. The Operational Framework: A Three-Stage Strategy for Proactive Success
The path forward was clear: a structured, cross-functional initiative was required to systematically dismantle these gaps.

Phase 1: Data Discovery & Root Cause Analysis — Exposing the Truth
The first, non-negotiable step was to let the data speak. We conducted a rigorous analysis of support tickets, segmenting them by:
- Issue Category
- Product Module
- Customer Segment (e.g., size, industry)
- Implementation Pathway (e.g., standard, accelerated)
The result was a revelation: Over 40% of all tickets were directly related to onboarding and configuration issues. The data painted an even starker picture when comparing implementation pathways. Customers who underwent an "accelerated" or "lite" onboarding generated 2.3× higher support ticket volume than those who received a full, structured implementation. This was the irrefutable link between implementation quality and support demand.
Phase 2: Structural Alignment — Building a Bridge Between PS and Support
Armed with this evidence, we redesigned the operational interface between the two teams. The cornerstone was a standardized, mandatory PS-to-Support handoff framework.
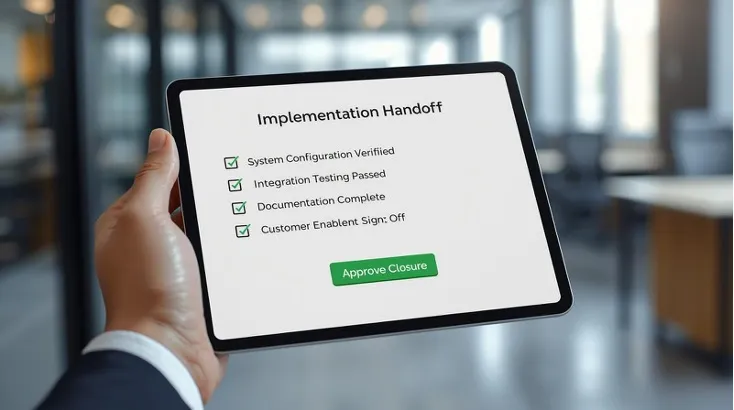
- Configuration Validation Checklist: Before any project could be marked "complete," PS was required to validate and sign off on a comprehensive checklist, including:
- System configuration verification against a standard template.
- Successful integration testing results.
- Formal confirmation of environment readiness.
- Implementation Documentation Standard: Every project now produced a structured "handoff package" containing:
- A clear system architecture diagram.
- A log of all custom configurations and their rationale.
- A list of known limitations or workarounds.
This documentation was then ingested into the support knowledge base, making it instantly accessible to every agent.
Phase 3: Preventive Enablement & Feedback Loops — Closing the Loop for Continuous Improvement
The final phase focused on building a sustainable, self-improving system.
- Structured Customer Enablement: The definition of "onboarded" was fundamentally changed. PS now integrated formal enablement milestones into every project, including:
- Role-based customer training sessions focused on workflows, not just features.
- Delivery of implementation playbooks tailored to the customer's use case.
- Provision of operational best practice documentation.
- Closed-Loop Feedback Between Support and PS: We institutionalized a monthly "Ticket Pattern Review" meeting. Support leadership presented trends to PS leadership, focusing on:
- Recurring configuration errors: Are we building things wrong?
- Product usability gaps: Is the product itself causing confusion?
- Defect leakage: Are we delivering unstable code?

6. The Payoff: Quantifying the Strategic Impact
Within two quarters, the strategy yielded tangible, measurable results across the entire organization.
7. Analysis: Key Success Factors & Leadership Lessons
This was not just a process change; it was a cultural shift. Several factors were critical to its success.
- Data-Driven Decision Making: We replaced assumptions with evidence. The data showing the 2.3x higher ticket volume for accelerated onboarding was the undeniable proof needed to secure buy-in from all stakeholders.
- Cross-Functional Collaboration: We broke down the silos by creating a shared mission: delivering a successful customer. By aligning PS and Support around shared metrics (like onboarding-related ticket volume), we fostered a sense of joint ownership over customer outcomes.
- Preventive Thinking: The leadership team championed a fundamental shift in mindset from "putting out fires" to "fireproofing." This meant investing time and resources upstream to save exponentially more downstream.
8. The Evolution: From Proactive to Predictive Support Operations
This initiative successfully moved the organization from reactive to proactive. The next frontier is predictive. Emerging technologies promise to take this concept even further:
- AI-Driven Ticket Pattern Detection: Machine learning can now identify at-risk customer segments or configurations before they generate a ticket spike.
- Predictive Configuration Validation: Automated tools can scan a customer's environment during implementation, flagging potential issues based on historical data.
- In-App Onboarding Guidance: Contextual help and guided workflows can prevent user error and reduce the need for basic "how-to" tickets.
9. Conclusion: Redefining Support as a Symptom of Upstream Health

This case study makes one thing abundantly clear: Support volume is not a measure of customer success; it is a measure of upstream operational health.
Support and Professional Services are not separate functions; they are deeply interconnected stages of a single customer lifecycle. Support tickets are the symptoms of failures that occurred during implementation. By strengthening the onboarding process and creating a structured, collaborative handoff, organizations can systematically eliminate avoidable support demand.
The path to a lean, efficient, and scalable support operation does not lead to a larger hiring budget. It leads upstream, to the very beginning of the customer journey. The most powerful support strategy is to make yourself less needed by building better, more prepared customers from day one.
10. Appendix: A Comprehensive KPI Framework for Cross-Functional Success
To sustain this alignment, we recommend a unified KRI framework that tracks both leading and lagging indicators.
| Support KPIs (Lagging Indicators of Upstream Health) |
Professional Services KPIs (Leading Indicators of Support Health) |
|---|---|
|
Operational Efficiency - First Response Time (FRT) - Time to Resolution (TTR) - SLA Adherence % - Ticket Backlog & Aging Quality & Impact - First Contact Resolution (FCR) - Escalation Rate - Onboarding-Related Ticket Volume (Key Metric) Customer Experience - Customer Satisfaction (CSAT) - Net Promoter Score (NPS) Product Health - Defect Leakage Rate (Tickets caused by bugs/PS errors) - Repeat Issue Frequency |
Delivery Efficiency - Project Delivery on-time % - Handoff Package Compliance % (Critical) - Resource Utilization Rate Customer Impact - Project CSAT - Project Success Rate (met defined success criteria) - Enablement Milestone Completion % (Critical) Financial Health - Revenue per Consultant - Project Margin % |
Case study: SaaS organization · 32% reduction in onboarding-related tickets, 21% SLA improvement DOWNLOAD PDF VERSION